Clamp on flow measurement is well known and well understood by instrument engineers, but there are pitfalls in getting the installation right and simple errors that can be made.
This article discusses some of the main issues, and how the manufacturer provides the tools to help the user to diagnose the application and get the best possible result.
The benefits of a clamp-on ultrasonic flowmeter are obvious – it does exactly what it says on the tin, you clamp a compact pair of ultrasonic transducers to the outside of the pipe and you measure the flow without any need to interrupt the process, no need for civil engineering and no need to break into the pipe. The principle of operation is based on the fact that an ultrasonic pulse will travel across a pipe through the flowing medium more quickly in the direction of the flow than it will do against the flow, and that the difference between the two transit times is proportional to the flow velocity.
So far, so good – a high quality, modern clamp-on flowmeter will measure the two transit times very accurately indeed – down to the nanosecond level, so we know the transit time difference to a very fine degree. However, and here is a really important point – everything else is calculated from this core measurement.
A good clamp-on flowmeter is capable of measuring to a headline accuracy of around ± 0.5%, because that’s the accuracy that is reasonably achievable in terms of the velocity calculation that comes from the measurement of the transit time difference. And, of course, it follows that you can in theory extrapolate that to a similar ± 0.5% volumetric accuracy, as long as the application is perfect – smooth pipe, no corrosion, completely mixed and stable flow. Meanwhile, back in the real world where we all have to live, pipes often aren’t like that. We can ‘correct’ for a variety of conditions and configurations, but these are calculations based on assumptions and can’t fully compensate for a less than perfect application. However, the biggest problem that we see is that people sometimes don’t appreciate how important it is to do the fundamental thing – measure the pipe accurately!
Consider an application in one of these perfect pipes – just to illustrate the effect that comes directly from an incorrect measurement. Let’s say we have a pipe at 200 mm OD, with a 5 mm wall thickness. At a flow velocity of 1.96 m/s, with these parameters input into the flowmeter accurately, it will calculate a flow rate of 200 m3 per hour. If, on the other hand, the operator inputs the OD as 195 mm, the same flowmeter will calculate the flow rate at 190 m3/hr. In other words, an error of 5% has been introduced purely by making a measurement error of only 5 mm. It’s worth mentioning that a 5% error in pipe diameter would be the equivalent of an error in pipe wall thickness of only 2.5 mm, so it’s important to get both of these measurements right.
So, how can you make sure you have everything correct?
Help is at hand – onboard diagnostic functions help to make sure that the installation is correct and that sensors are correctly positioned. I’m going to look at some of the key elements that support an accurate installation. There’s a lot more depth in the diagnostics, but for the purposes of this piece I’m only going to look at those points that give us an immediate feedback of the quality of the installation and correct set up of the flowmeter.
First things first – it makes sense to get the sensors in the right spots to maximise performance and signal strength. The way we at Katronic go about this is with our Audible Positioning Assistant. After the basic pipe parameters have been entered using the Quick Setup wizard, the first screen you see is the positioning screen.
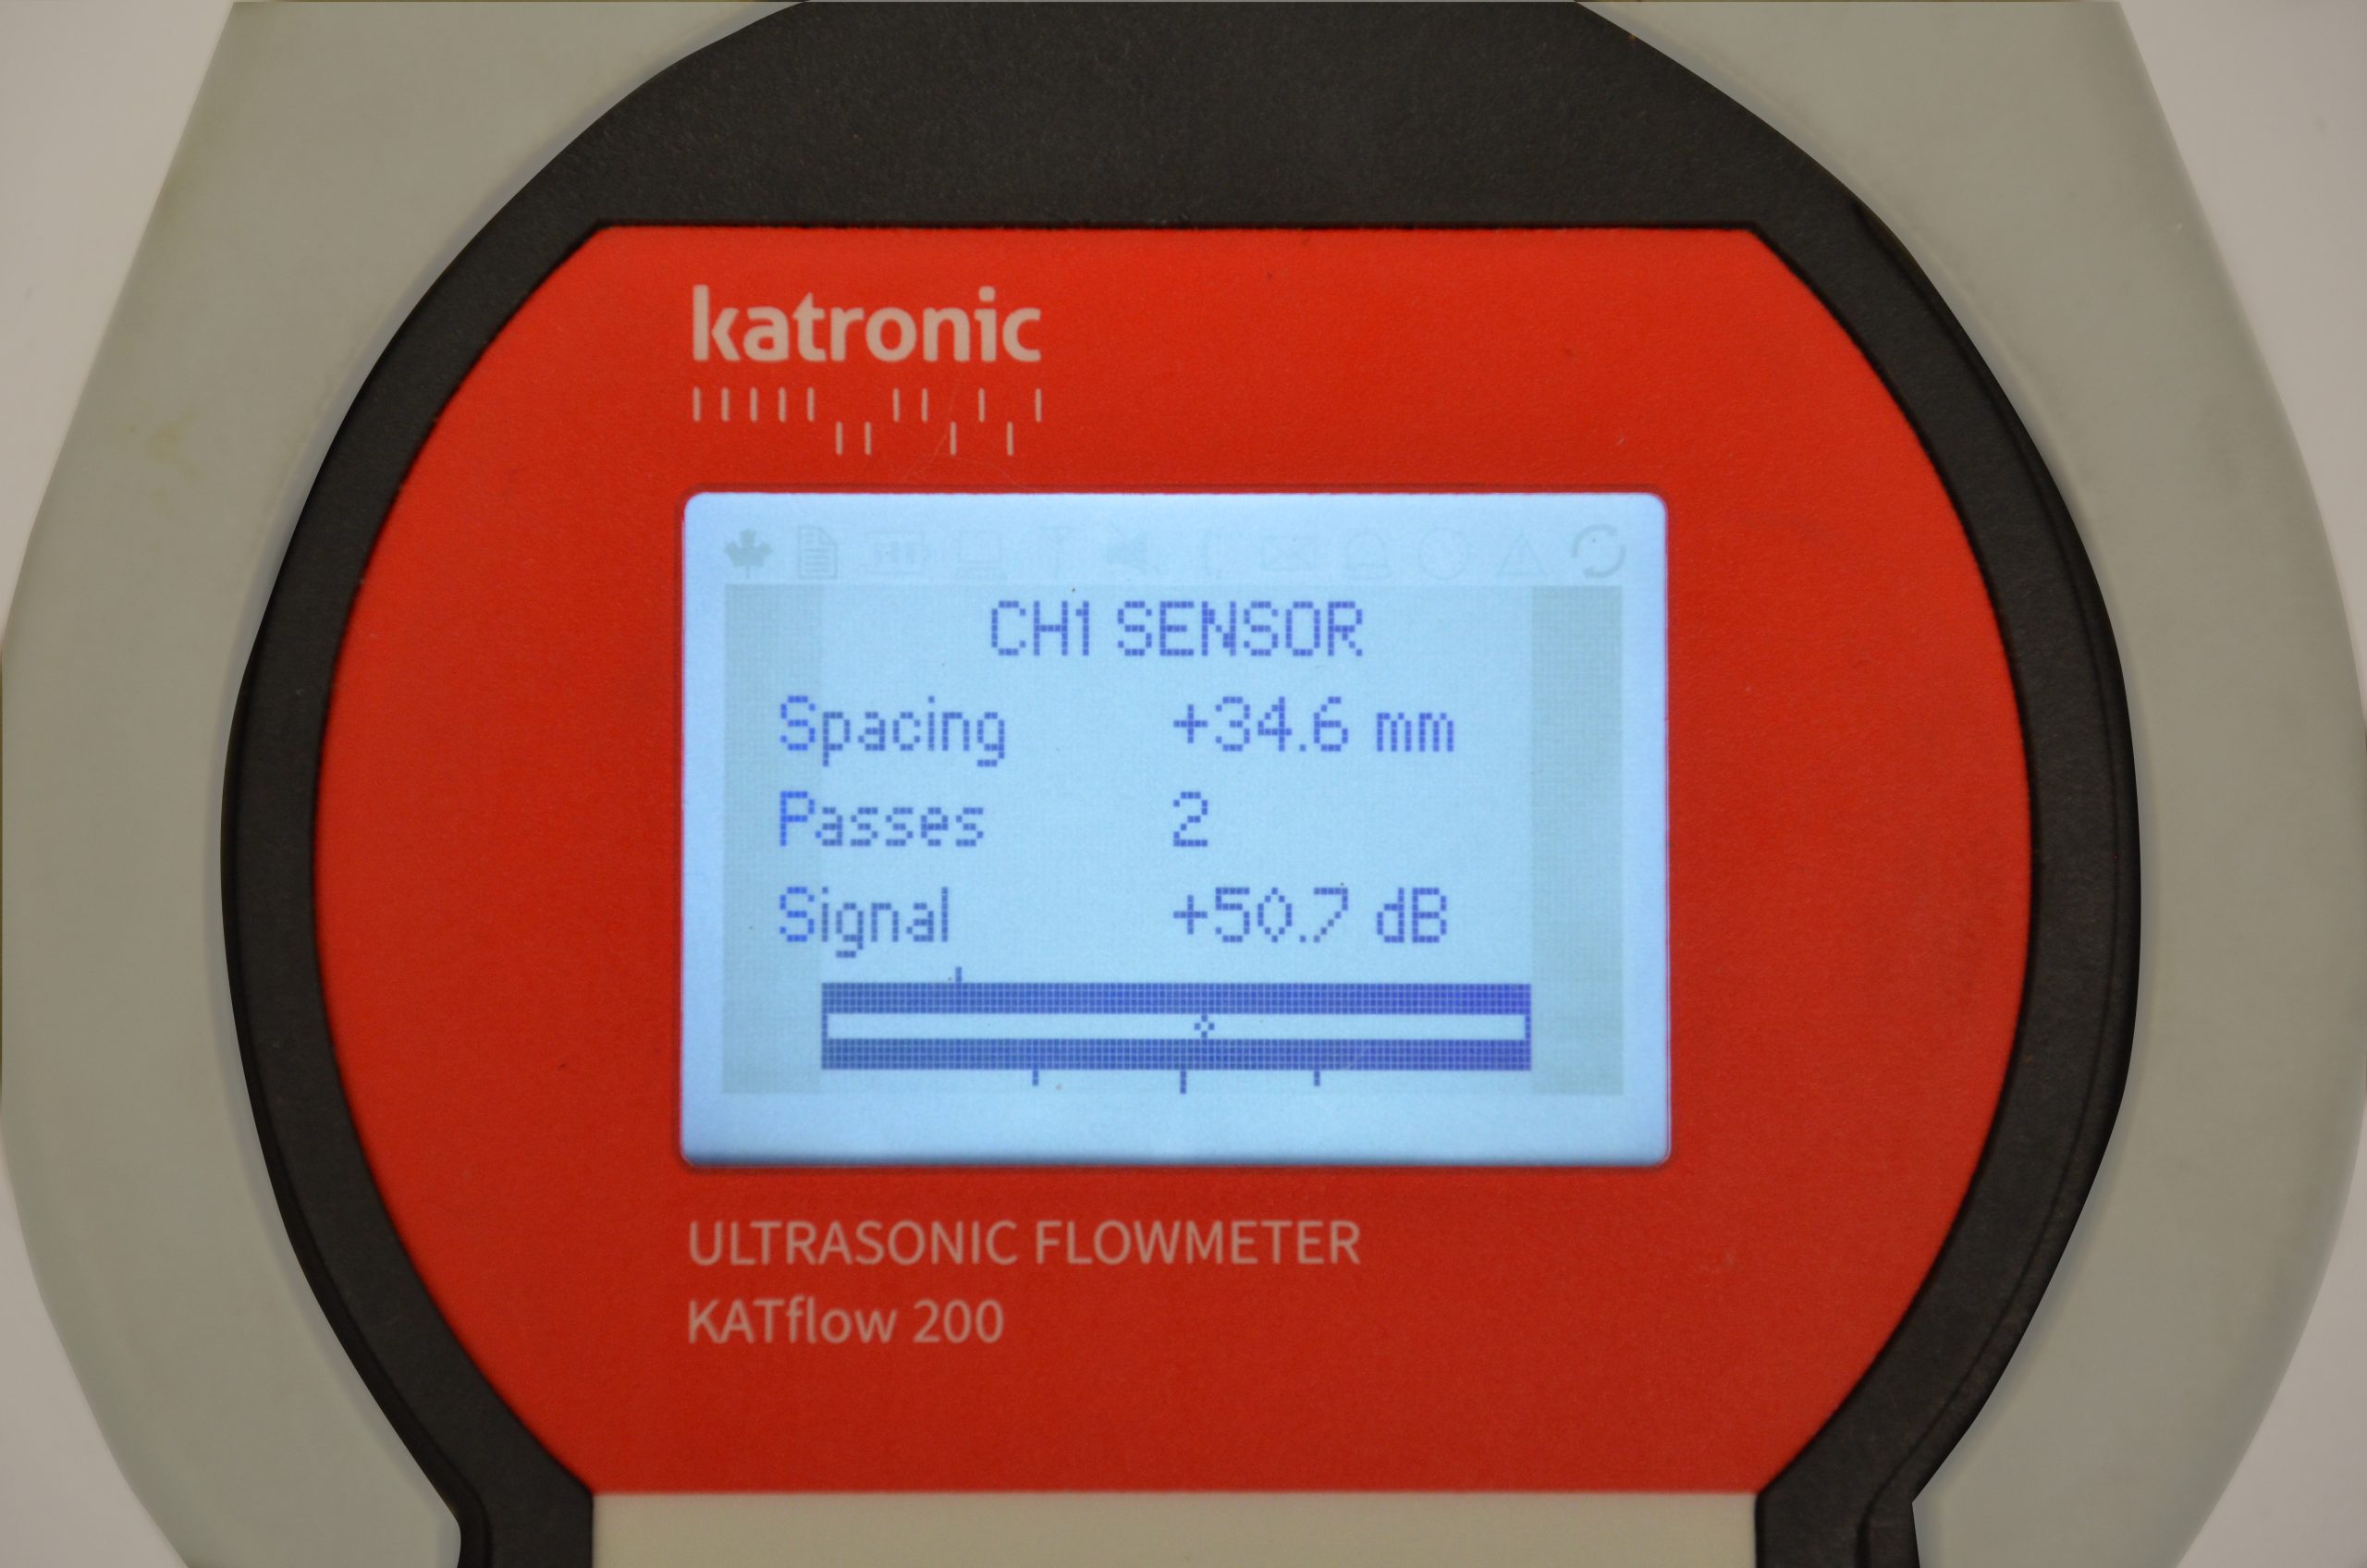
The flowmeter tells the user the recommended sensor separation, measured from the inner faces of the sensor bodies. Once the user has them in position, two bars across the screen indicate signal strength and signal confidence, with an additional dot in between them to help the user tweak the sensors into the perfect position. The dot moves as the user moves the sensors slightly closer together or further apart, a central position indicating the best possible signal.
OK – so here we have the first opportunity to check whether the flowmeter set up is correct. The sensor separation figure is of course calculated from the parameters that were entered, while the fine tuning using the dot is a ‘tweak’ driven by the signal strength being picked up by the flowmeter. In theory, the maximum signal strength should be within a couple of millimetres of the recommended sensor position. So, if the actual maximum signal is picked up in a significantly different place, that’s a very strong indication that the pipe parameters have been entered wrongly.
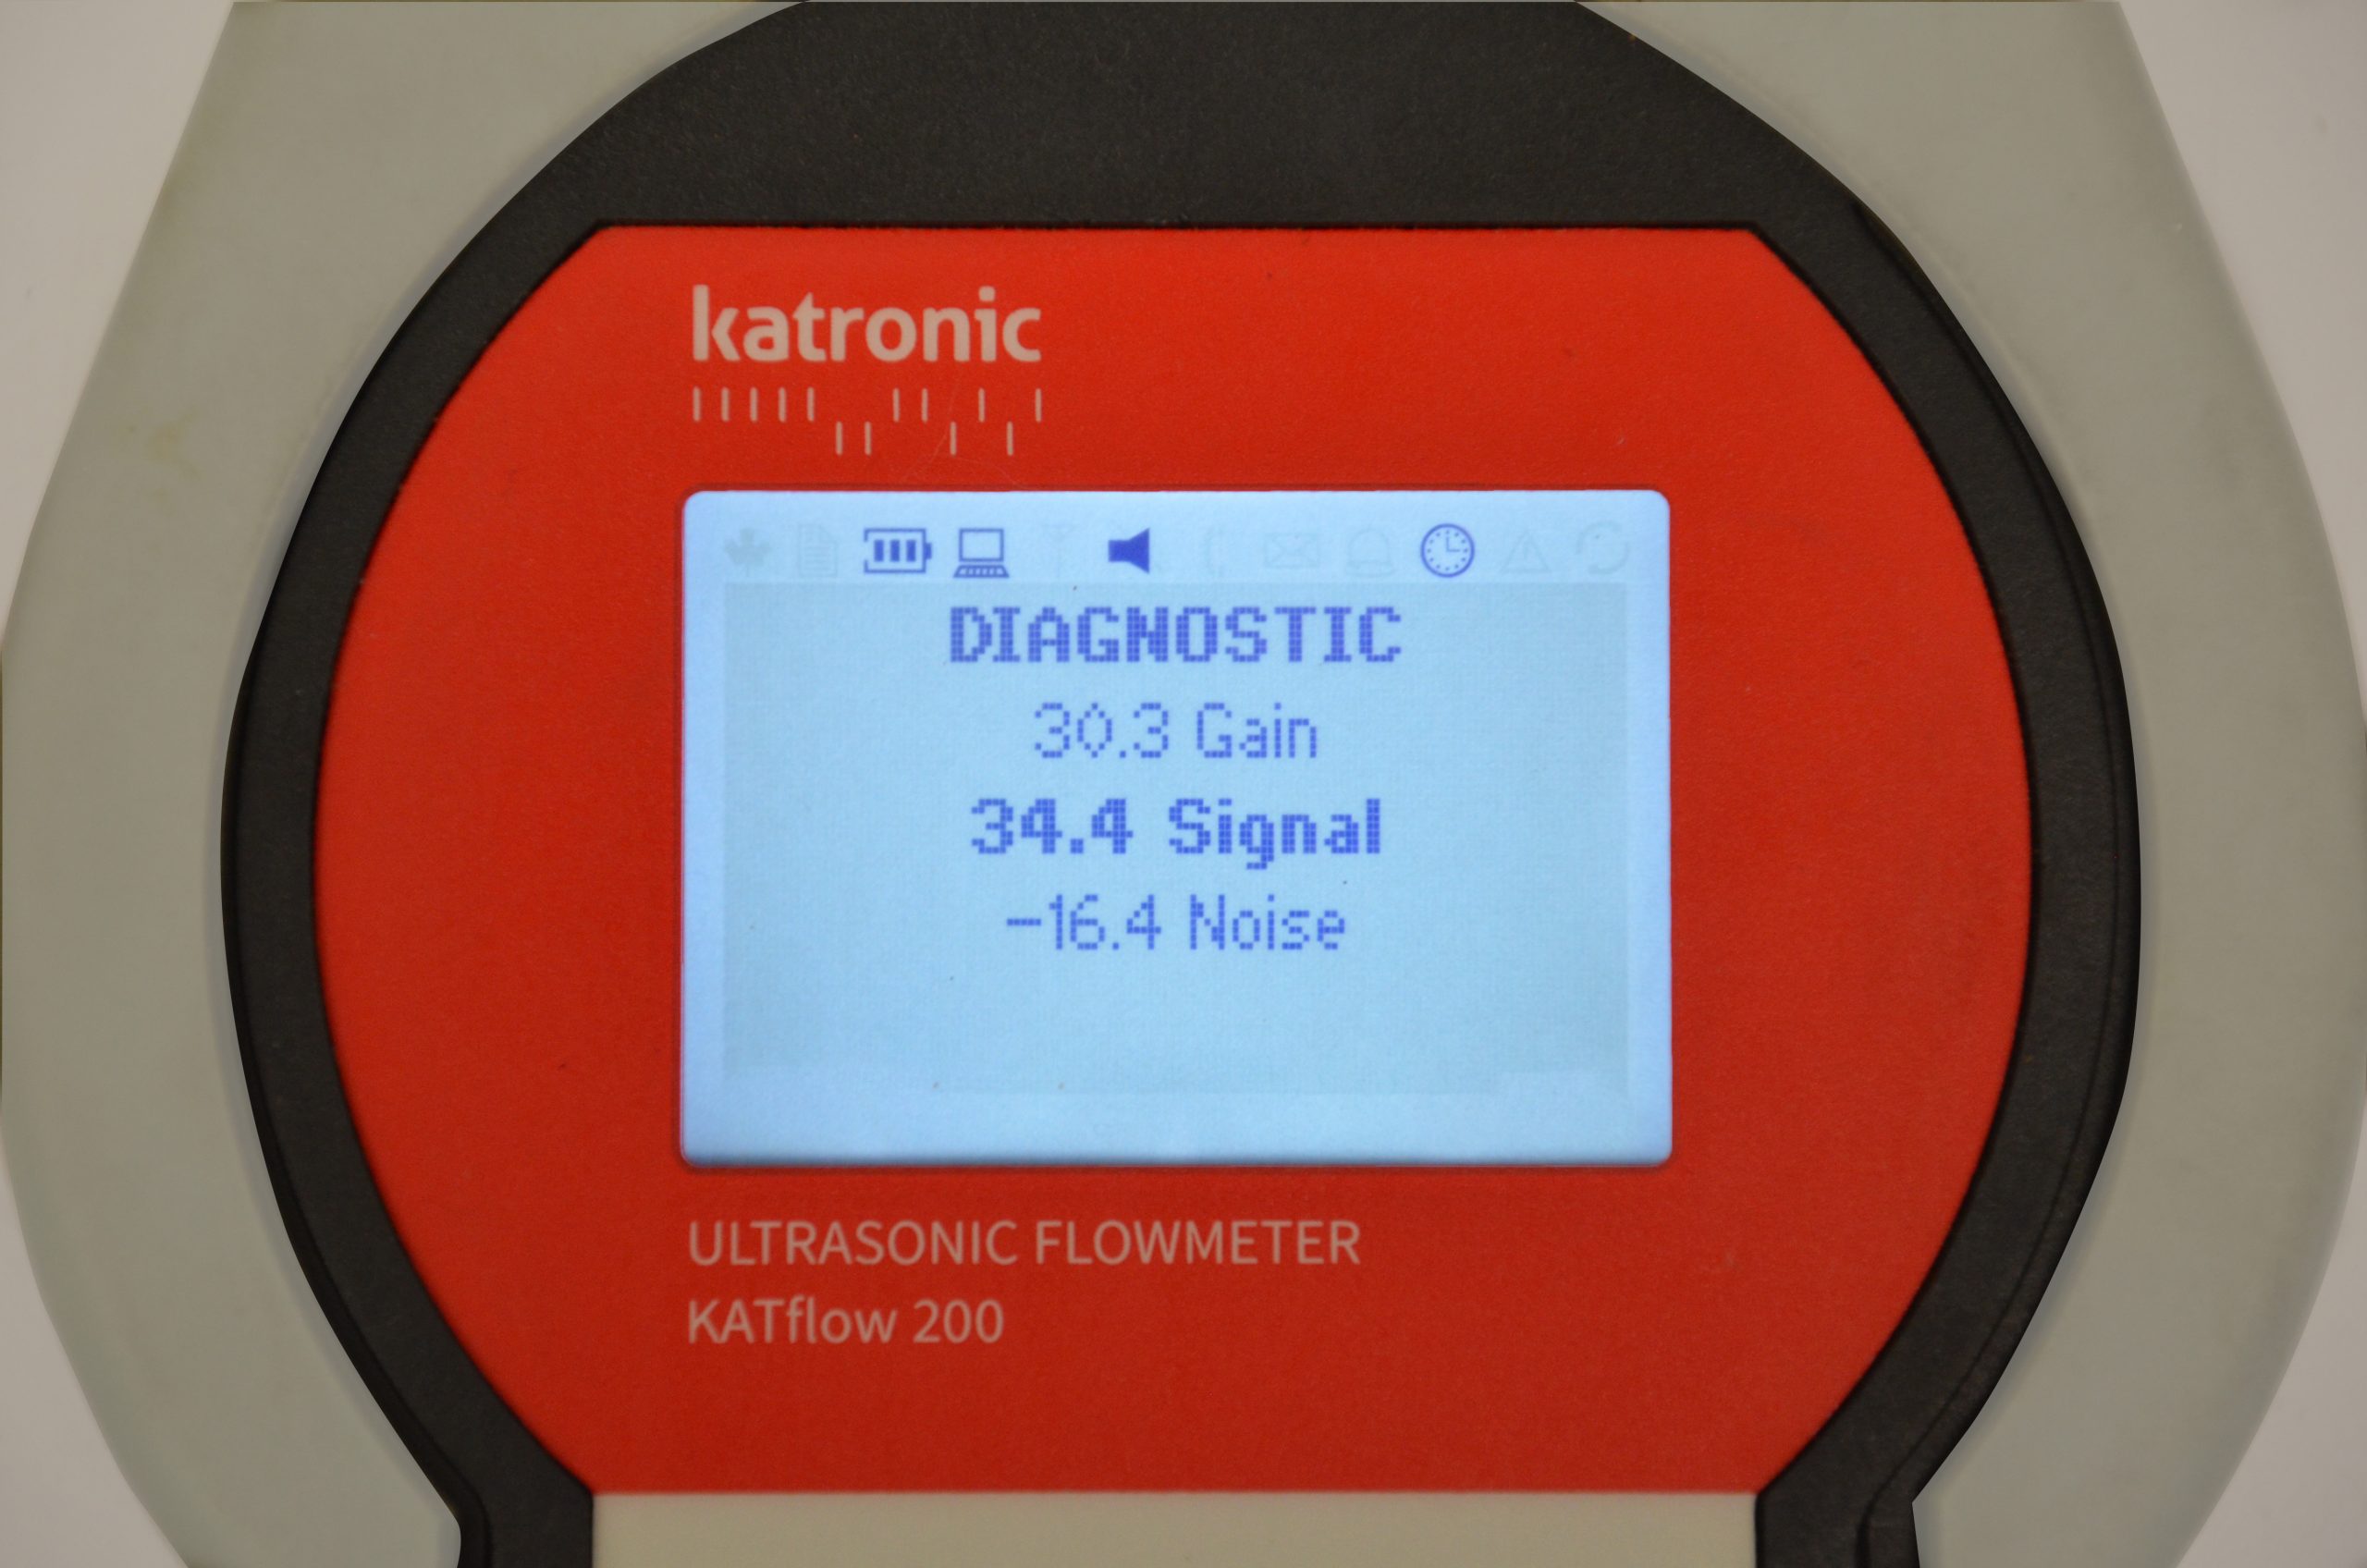
Entering the diagnostic screens, there is a whole host of data to help the user to check that everything is working properly. Although there is a ‘headline’ signal strength figure displayed, in most instruments that’s more accurately the ‘signal to noise ratio’ (SNR), which is calculated by subtracting the noise (electrical and acoustic) from the raw signal strength, both measured in decibels. So, that SNR could be a strong signal with high noise, or a weaker signal with very low noise. That data, taken with the ‘Gain’ figure which indicates how hard the flowmeter is having to work to get a signal, helps the person commissioning the flowmeter to understand whether the transducers are positioned properly, in the correct configuration and are of the right type to get the best possible result for the measurement.
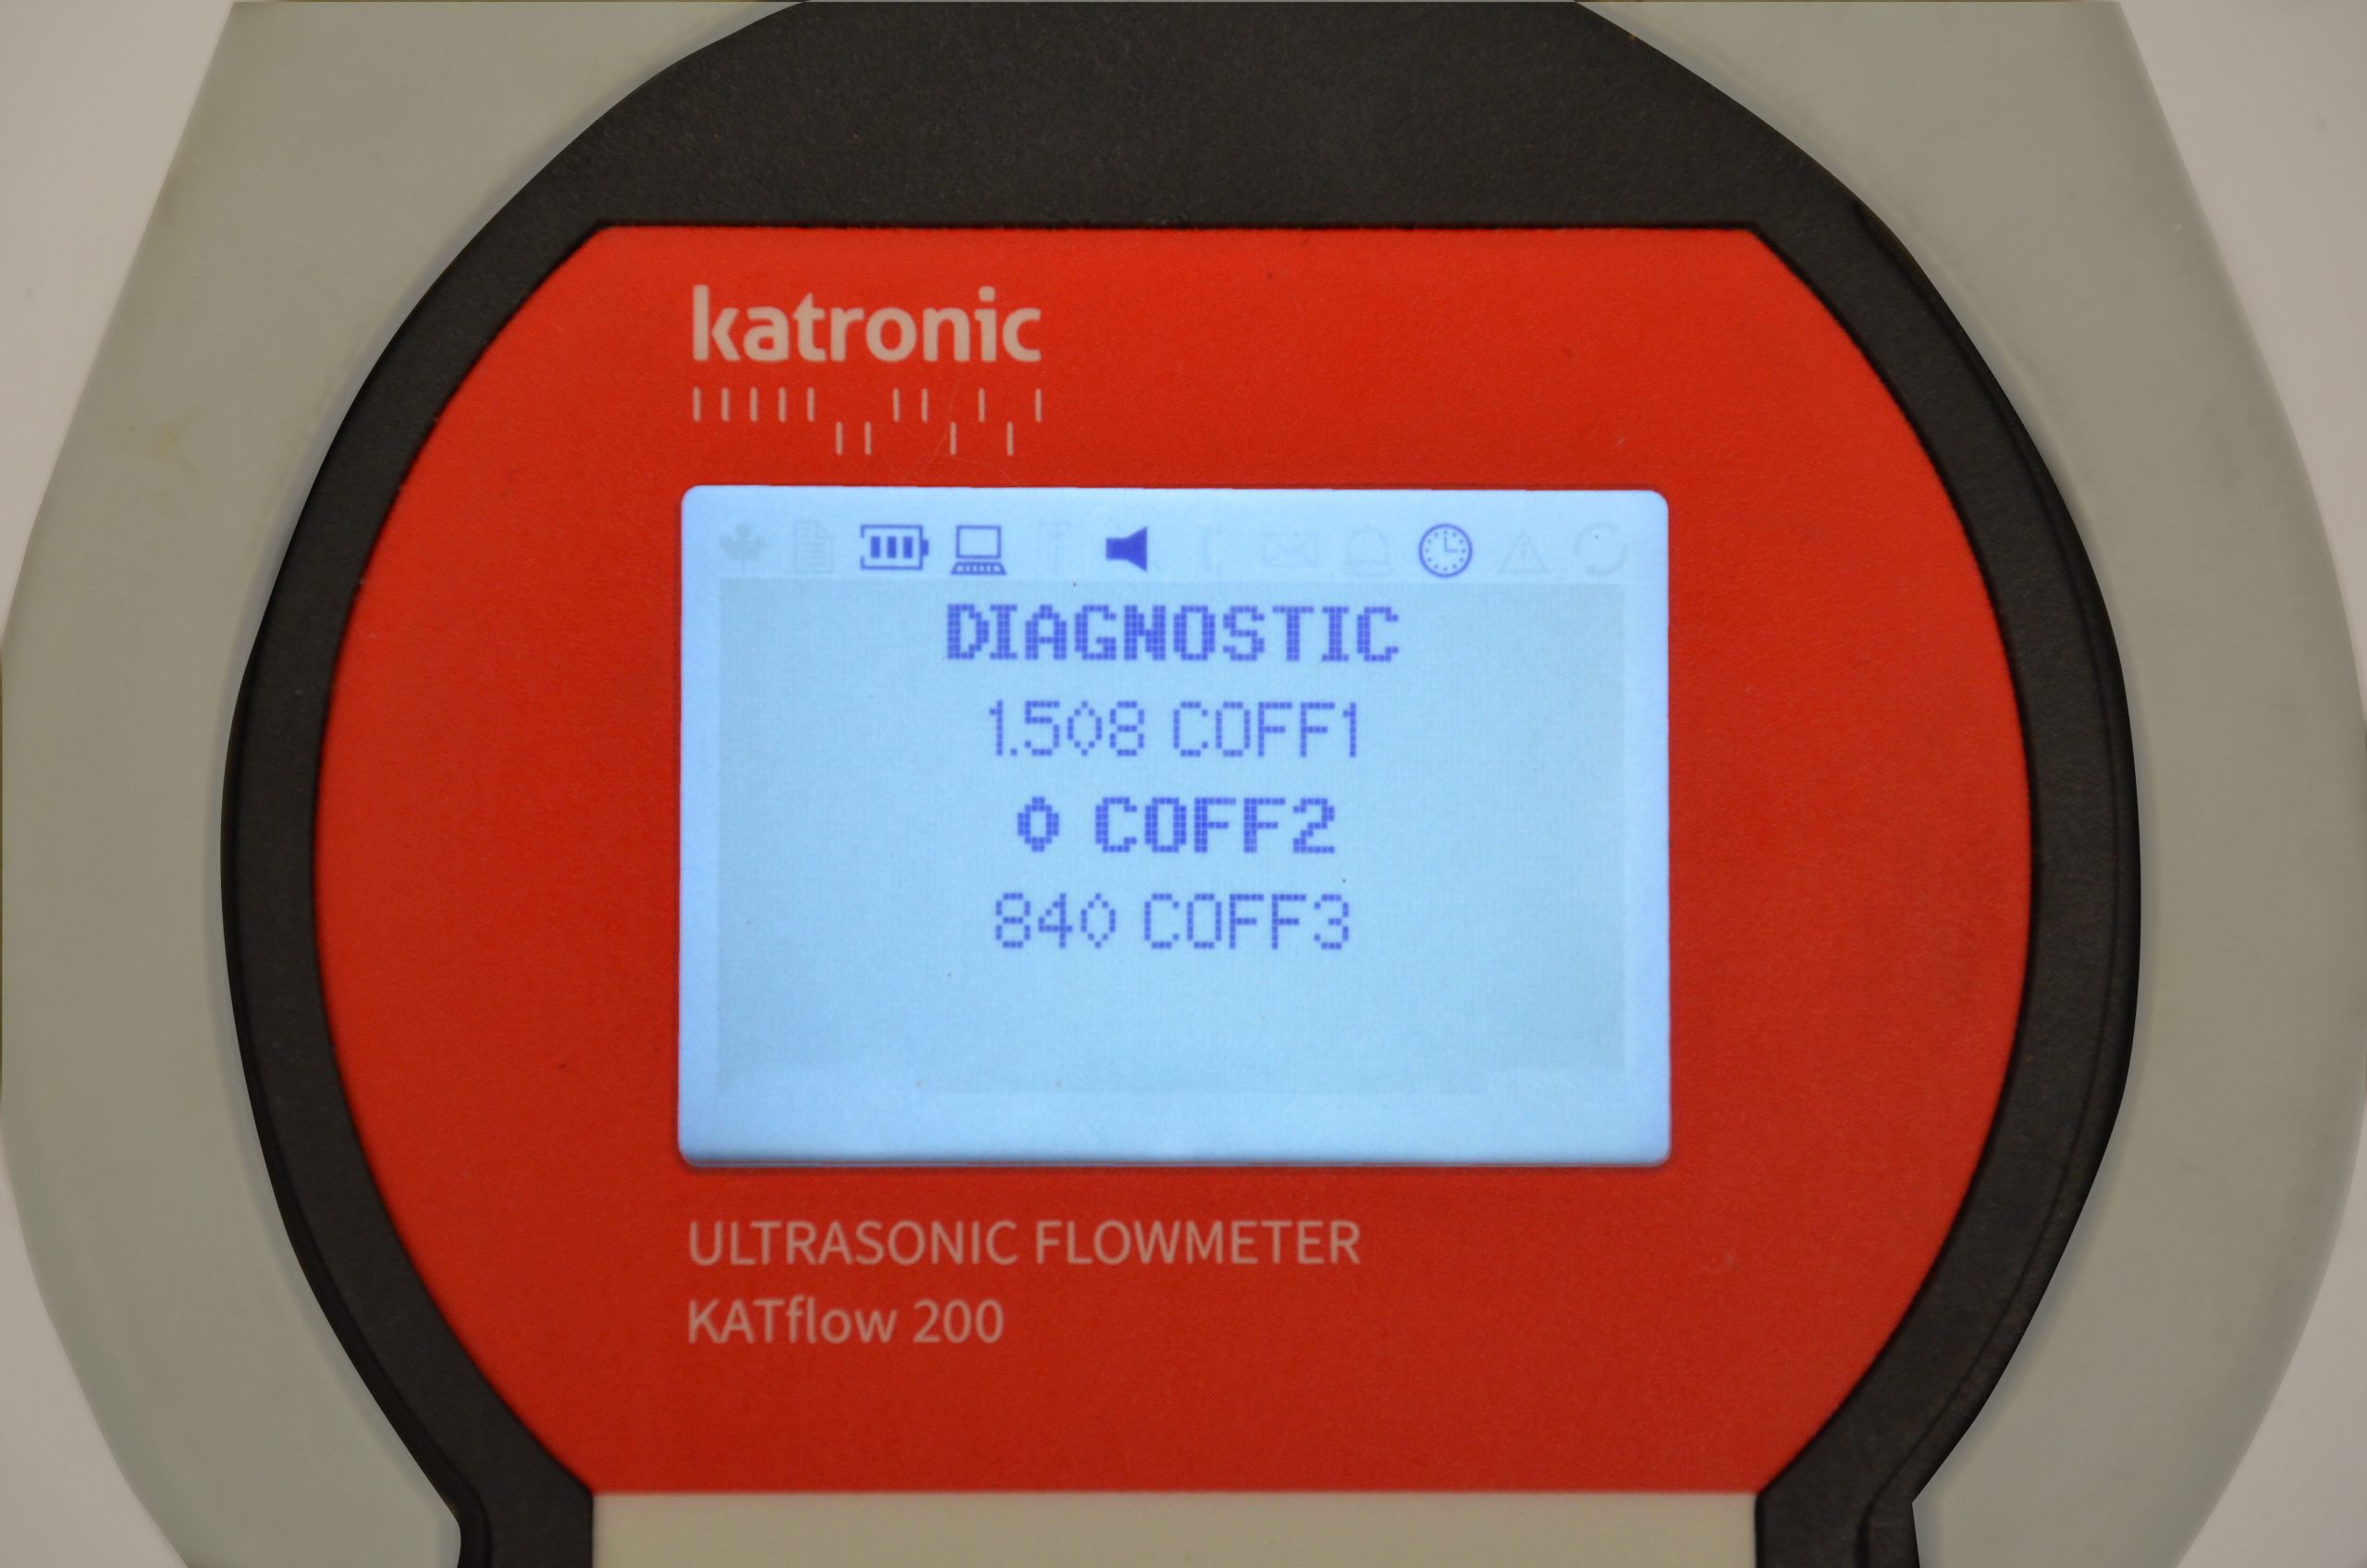
There are other diagnostic functions available to the operator that helps them to troubleshoot applications. For example – the degree of variability of the transit time difference is displayed as a coefficient – larger the variability of the flow, the more irregular the signal and the less accurate the measurement. That’s true for any flowmeter, of course, not just clamp-on ultrasonics!
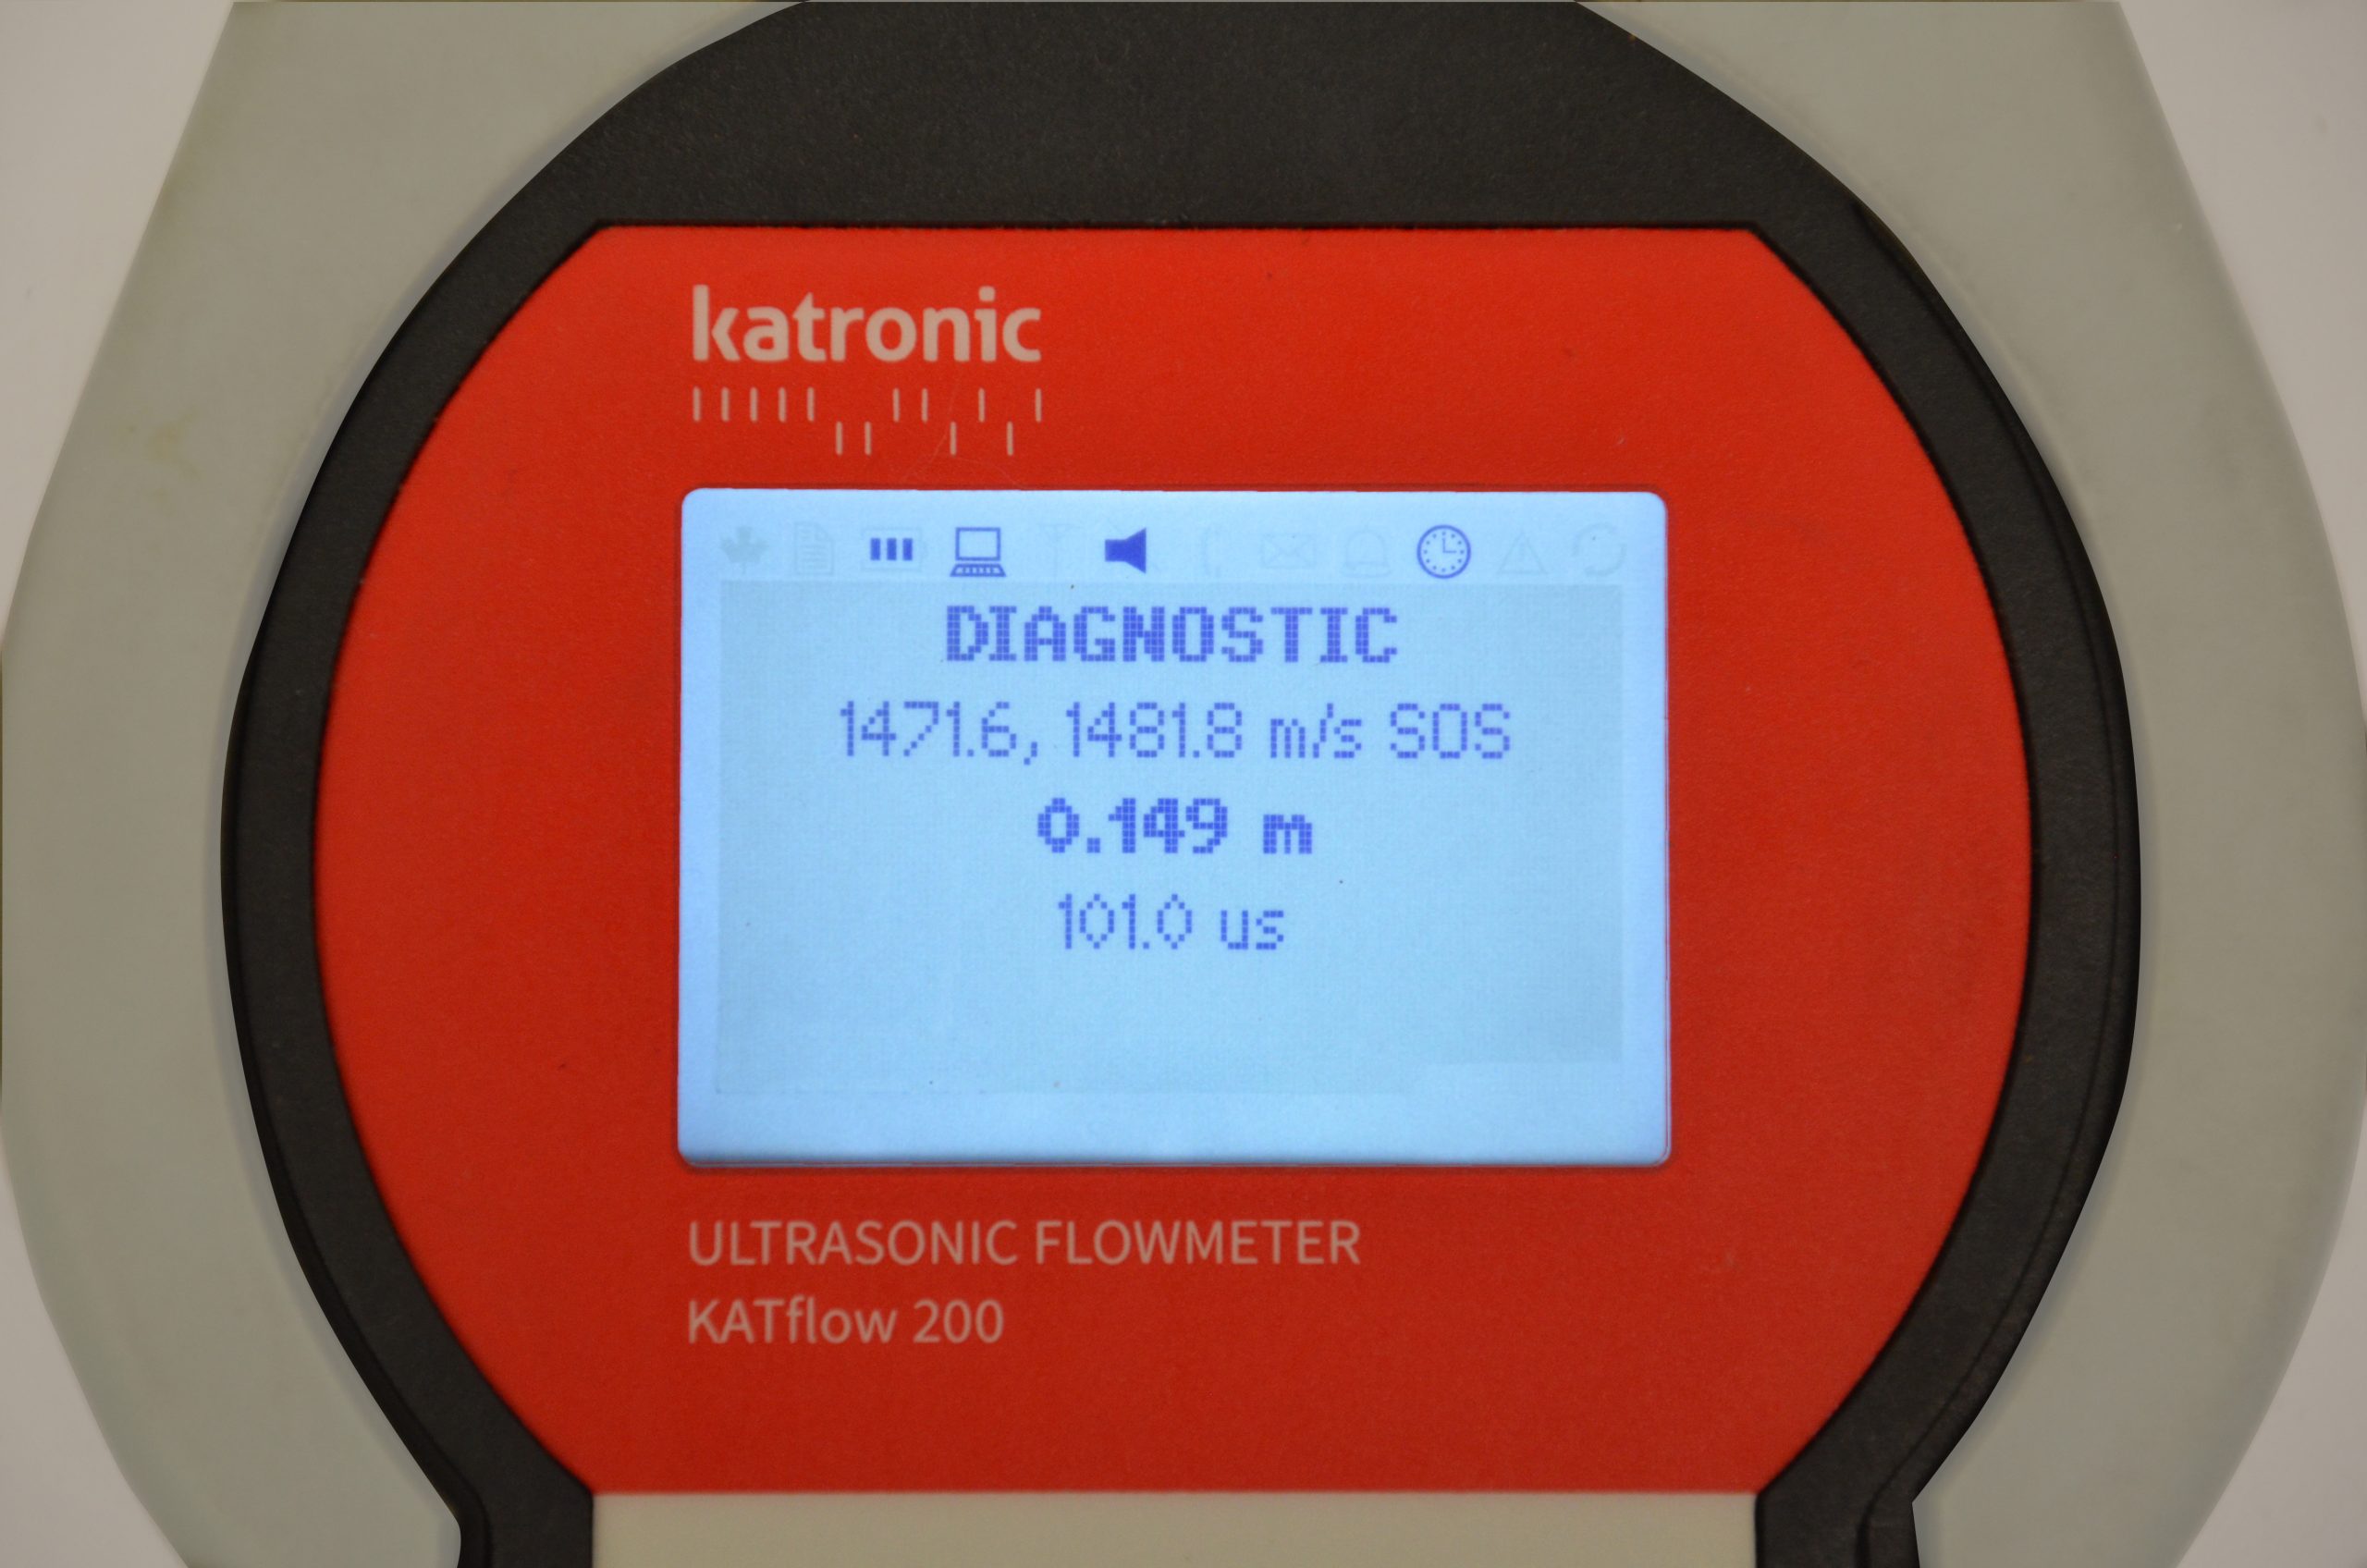
One of the most valuable screens for initial set up is the speed of sound (SoS) screen. Variations in the speed of sound don’t significantly affect the flow measurement accuracy because we’re measuring transit time difference, but they do affect sensor placement. For that reason the flowmeter has a set of tables that indicate SoS for different temperatures in each medium we measure. The flowmeter also measures the time a transit takes, so can display the actual speed of sound measured in the application, a simple calculation of distance the signal travels divided by the time taken. These should agree, pretty much. Any significant difference between the measured and theoretical speeds of sound is a pretty clear indicator that the parameters have not been correctly entered into the meter.
In most applications, the operators will not need to be concerned with the details of the diagnostics, but there are occasions where it is valuable to understand some of the detail of the application, especially when commissioning a permanently installed flowmeter in a more difficult application. Clamp-on flowmeters such as Katronic’s well-proven KATflow range, represented in the majority of frameworks across the UK water industry, provide the user with a powerful series of tools to help the operator to really understand how the pipe, the flow and the process are all taken together to give them the best possible performance and reliable, accurate measurement.

