MOSL (Market Operator Services Ltd) has published a new Drought Restriction Dashboard and searchable map.
The dashboard and map build on the CMOS data enrichment by Water Resource Zone (WRZ) which was undertaken to support water efficiency efforts across the market. They use collated aggregated data on the drought restriction statuses of the 133 WRZs across England and Wales (defined as part of each water company’s Water Resource Management Plan (WRMP)).
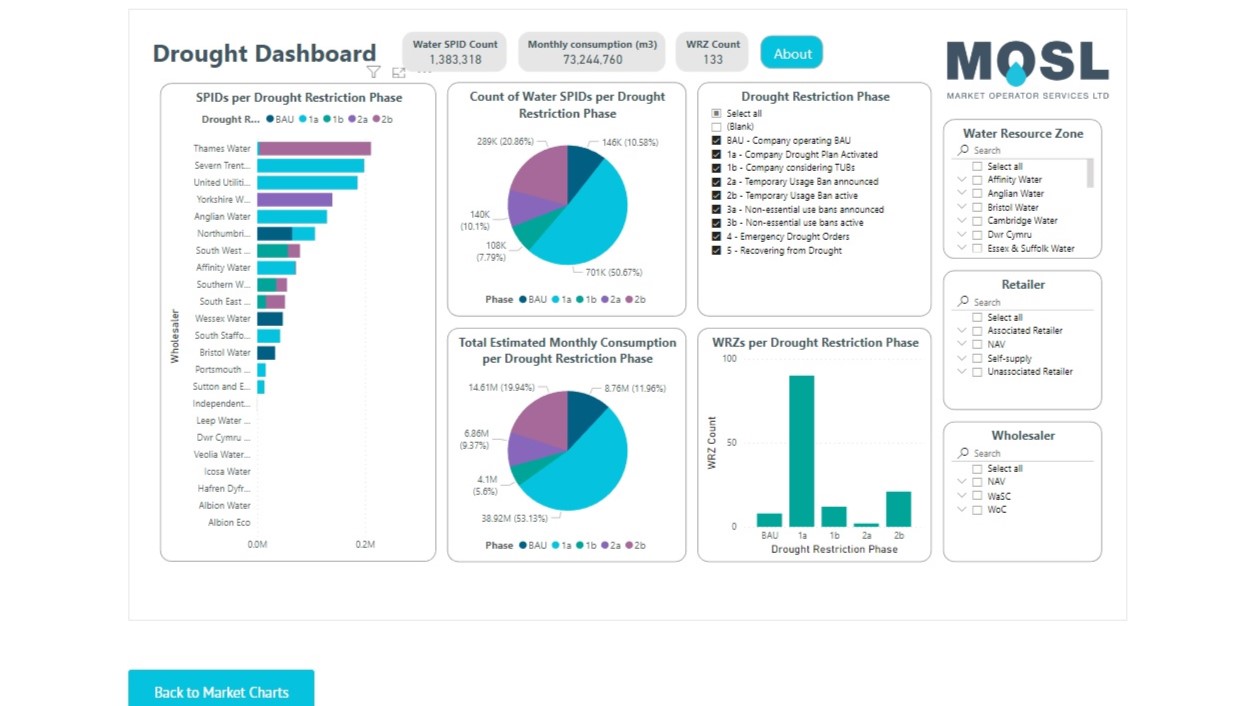
The Market Summary Drought Restriction Dashboard provides a summary market view of non-household supply points and an 18-month view of water consumption by Drought Restriction (DR) status and WRZ. Data can be filtered by wholesaler, retailer, WRZ and DR status, enabling users to see the percentage of supply points and non-household consumption by restriction status and the wholesalers that have announced water restrictions. The dashboard provides a summary aggregated view of non-household water supply points, a best view of average water consumption and drought restriction status by wholesaler, retailer and WRZ. This dashboard is available on the MOSL website via the Environmental Impact sub-page or Market Charts section.
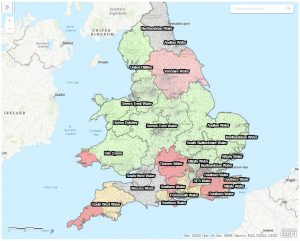
 The Searchable Drought Restriction Map provides a national view of WRZ and DR statuses by postal sectors for England and Wales. Users can search areas of the map to view their drought restriction status. This dashboard is available on the MOSL website via the Environmental Impact sub-page.
The dashboards and map support the objectives of the new Retailer Wholesaler Group (RWG) Drought Sub-group, which has been established to improve wholesaler-retailer collaboration and consistency around the market’s response to the current drought and update current guidance on communications with business customers in drought events.


